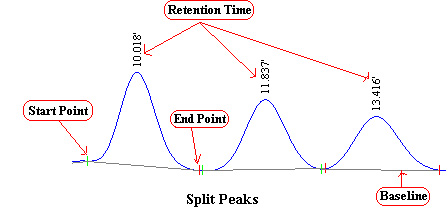
| ◇When an independent peak is detected, a short green line
would be marked to indicate the Start Point and a short red line would be marked to
indicate the End Point of the peak together with its Retention time. If a few
connecting peaks are treated as split, (refer to the diagram below) each of the peak would
have its own Start Point and End Point as shown below. Should the End
Point of one peak coincides with the Start Point of the next peak, a short
green line would be displayed instead. The Baseline that we use to integrate the area of
each peak is the line that connects the Start Point of a peak to its respective
End Point.
|
|
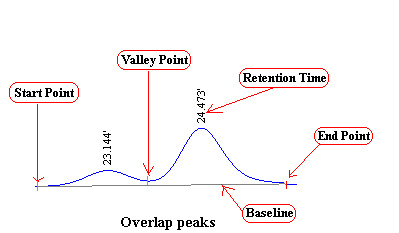
| ◇If two connecting peaks are
treated as overlap, (refer to the diagram below), a short green line would be marked to
indicate the Start Point of the group of peaks, another short green line would be
marked to indicate the Valley Point. A short red line would be marked to indicate
the End Point of the group of peaks. When integrating the area of each peak, a
vertical line is dropped from the Valley Point to the Baseline, which is the
line that connects the Start point of the group of connecting peaks to the End
Point of the group of connecting peaks.
|